Research Time Before Purchase by Category
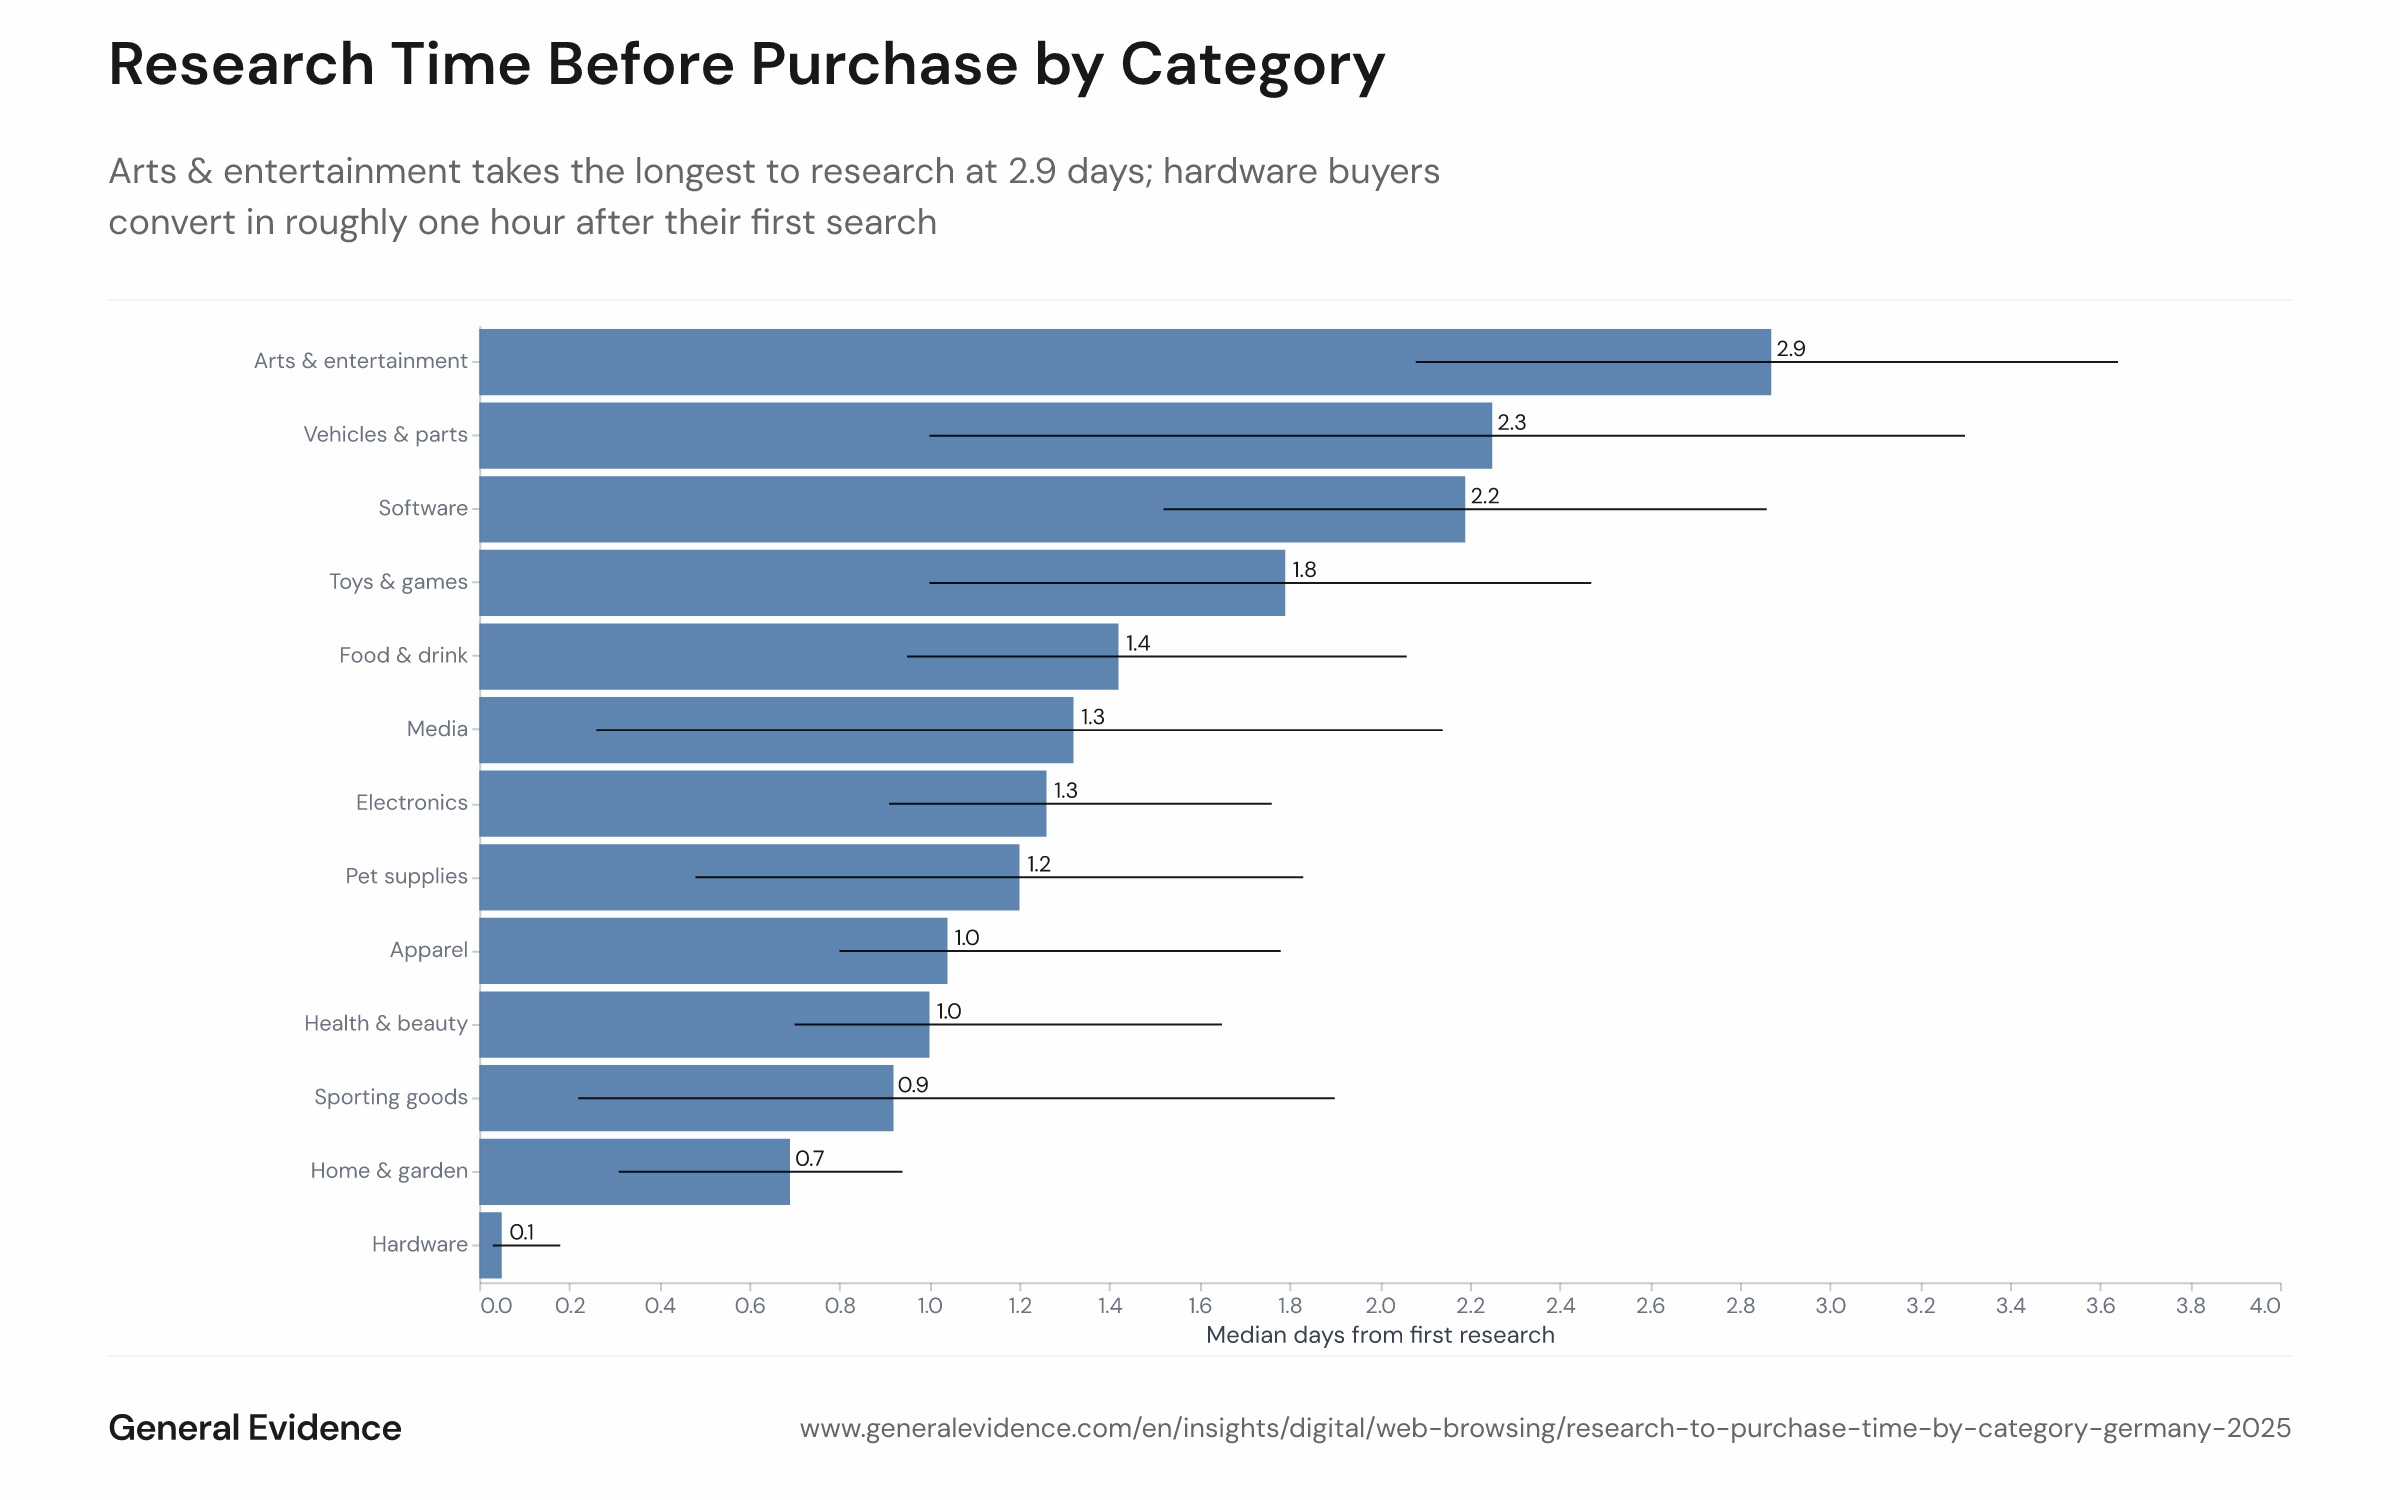
Review 2025: Arts & entertainment takes the longest to research at 2.9 days; hardware buyers convert in roughly one hour after their first search
Info
- Sample size
- n = 19,016
- Data date
- 2025
- Segment
- All segments
- Platform
- Browsing, Purchases, Search
- Market
- Germany
Analysis
Category is the strongest predictor of how long a German online shopper's pre-purchase research phase lasts — a 57-fold spread separates the fastest and slowest verticals. Hardware buyers convert in a median of just 0.05 days (~one hour), with 70% completing the purchase on the same day as their first search. At the other end, arts & entertainment purchases take a median of 2.9 days, with only 31% same-day conversion.
Why entertainment and software demand longer consideration
High-consideration categories like arts & entertainment (2.9 days), vehicles & parts (2.3 days), and software (2.2 days) share a common trait: purchases tend to be experiential, difficult to return, or tied to longer-term commitments — factors that reward careful evaluation. Software subscriptions and digital entertainment products in particular often require compatibility checks and peer-review validation before checkout, aligning with the finding that 82% of software buyers say peer experiences heavily influence their final choice. Hardware and home & garden categories, by contrast, tend to involve more functional, specification-driven decisions where the research and purchase intent compress into a single session. For the overall German online purchase funnel, the median research-to-purchase time across all categories sits at 1.15 days — see How long Germans research before buying online for the full distribution.
This analysis is based on public segment data. For deeper cuts, use our Enterprise interface.
Ask your own question of this data.
This chart is one cut of the panel. In a demo we answer your question on the same data, live.
Methodology
The analysis covers German online shoppers throughout 2025. Purchases were drawn from online product sources including Amazon orders, email order confirmations, and TikTok Shop transactions, categorised using the Shopify product taxonomy. Research touchpoints — product-page visits and categorised Google search queries — were matched to the same product category as each purchase. The funnel was built by chaining touchpoints backward from the purchase date with no gap exceeding seven days, within a 90-day lookback window bounded by the shopper's last purchase in that category. Only shoppers with observable browsing and search history for the full lookback period were included; the active-funnel subset represents roughly 16% of all qualifying purchase occasions. Median research-to-purchase times and same-day shares are shown per Shopify level-1 vertical. Each shopper's purchases were equally weighted to avoid distortion by heavy buyers.
These insights are based on the General Evidence Panel. Our data comes exclusively from users who are compensated for their anonymity. Become part of the panel & earn from your data