Gen Z vs. Boomer Online Spending in Germany
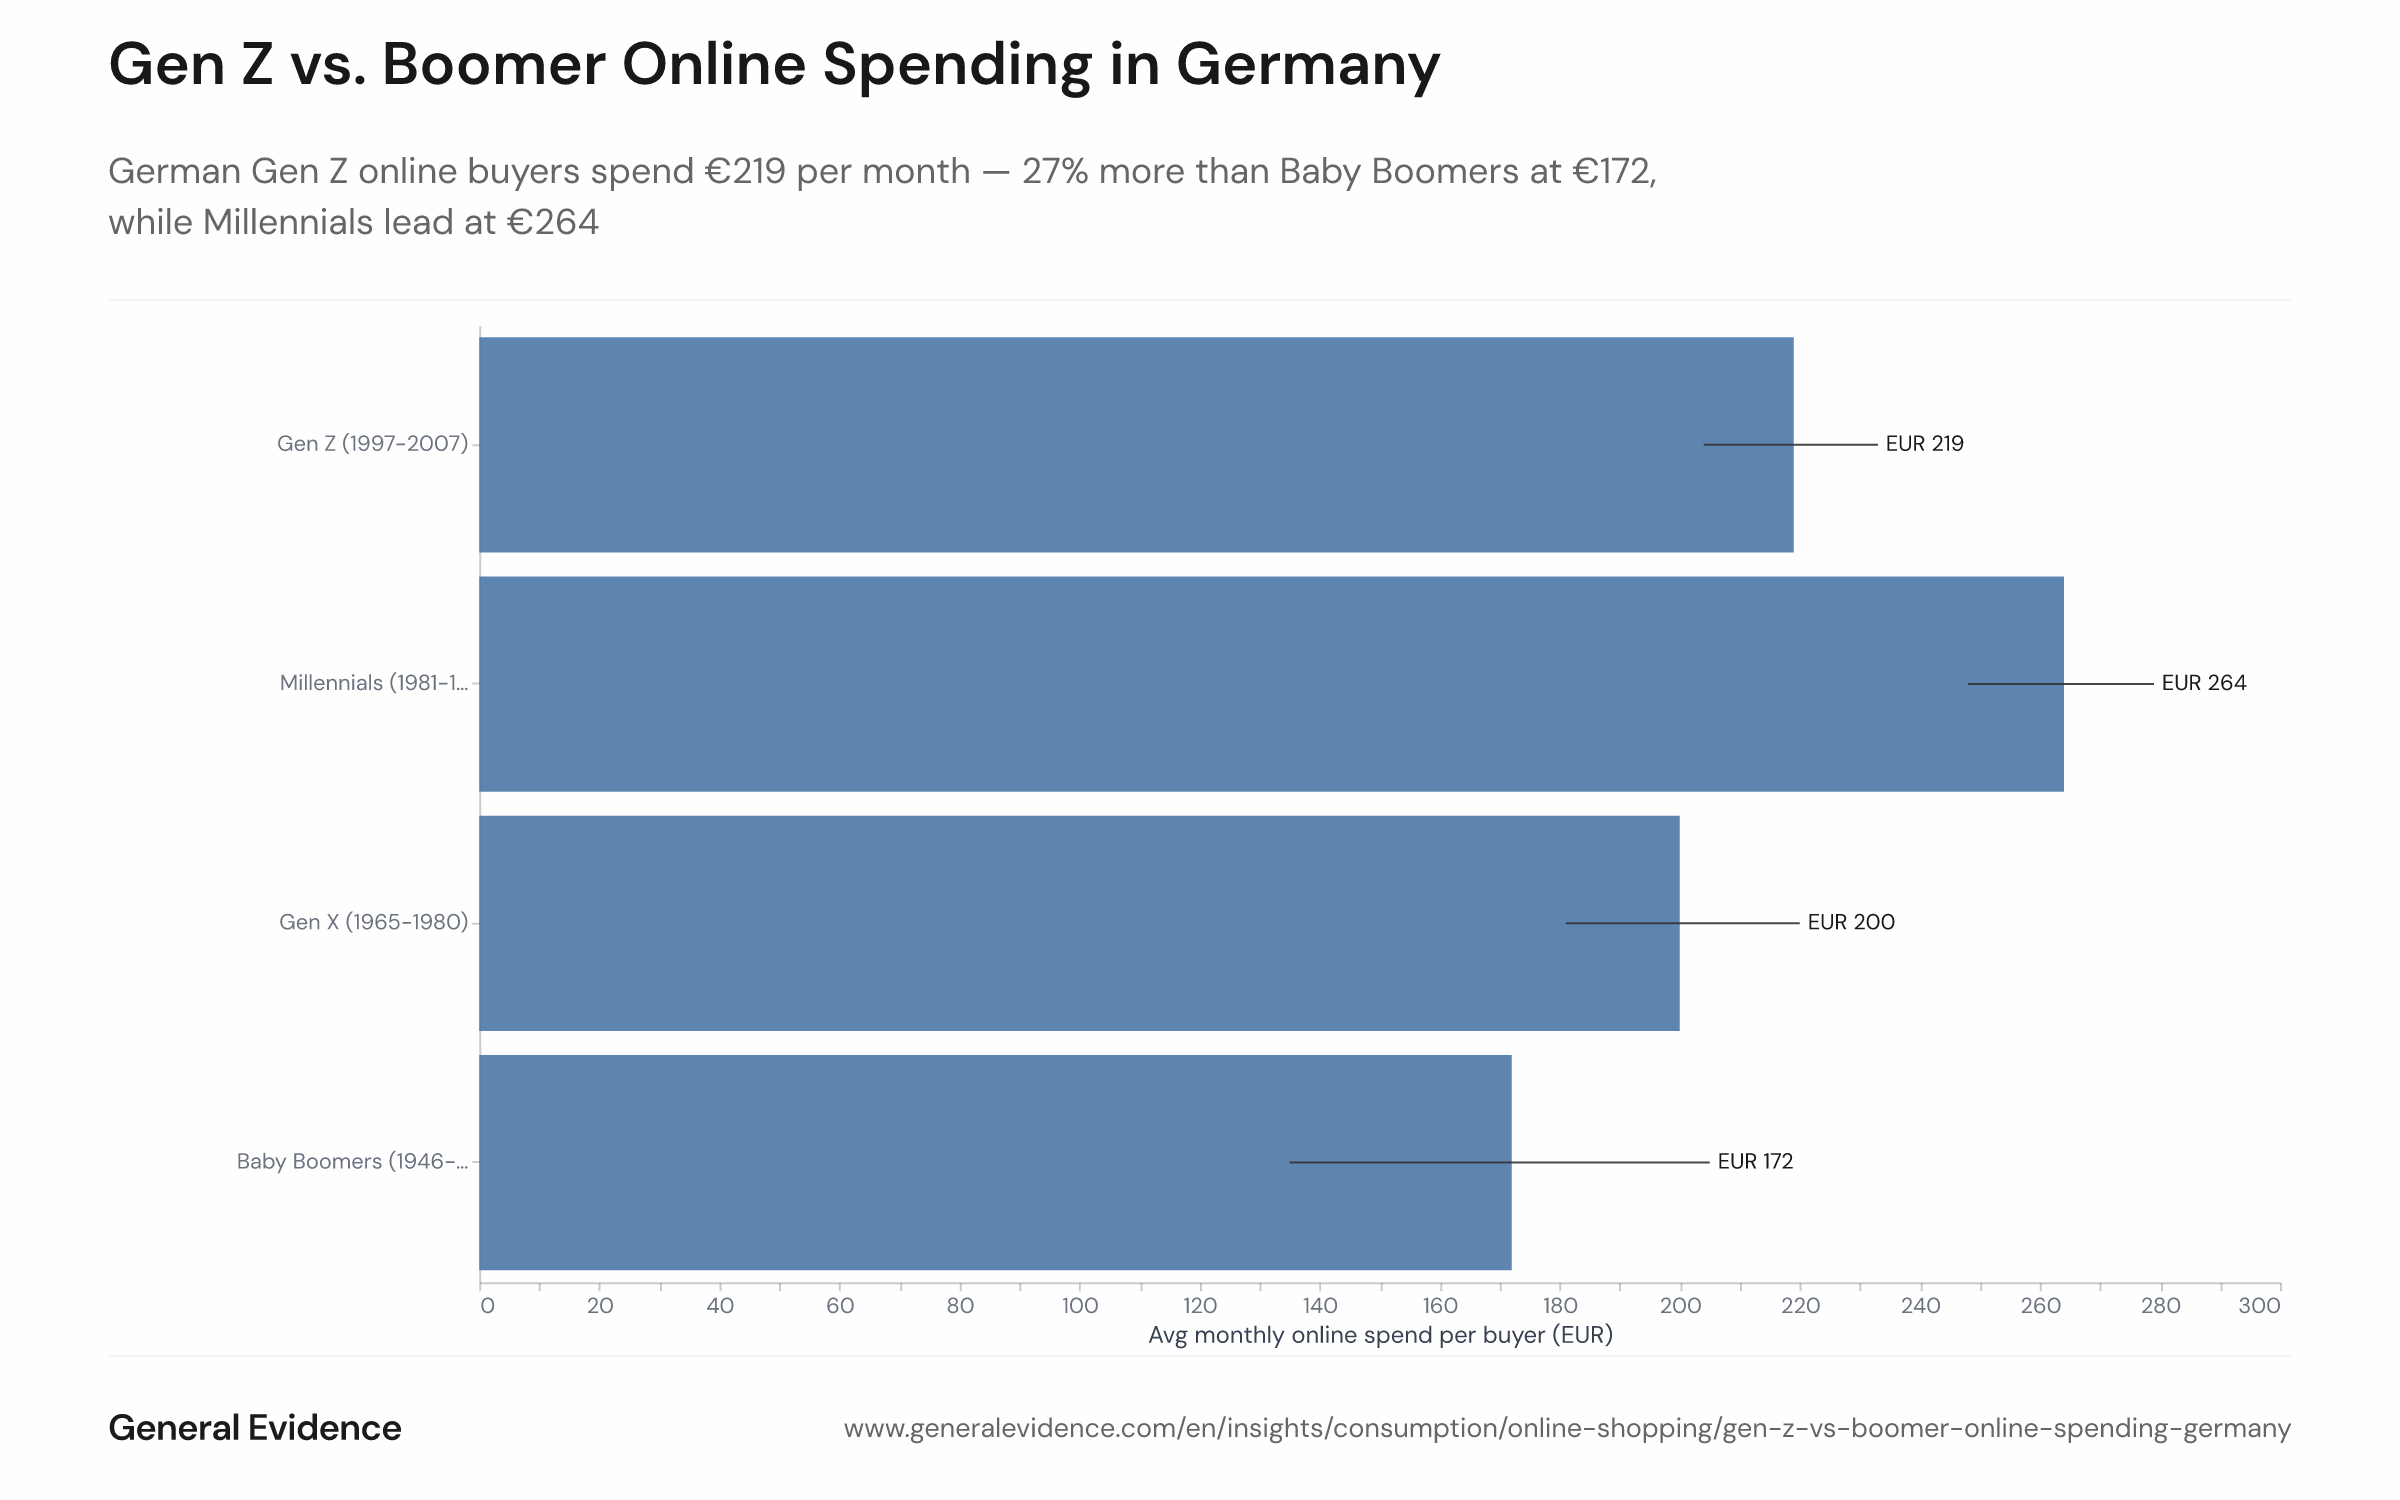
Review Sep 2025 – Aug 2026: German Gen Z online buyers spend €219 per month — 27% more than Baby Boomers at €172, while Millennials lead at €264
Info
- Sample size
- n = 9,674
- Data date
- Sep 2025 – Aug 2026
- Segment
- 16-24, 25-34, 35-44, 45-54, 55+
- Platform
- Purchases
- Market
- Germany
Analysis
German Gen Z online buyers outspend Baby Boomers by 27% — averaging €219 per month versus €172 — a gap driven entirely by larger baskets rather than higher order frequency. At 3.5 orders per month, Gen Z shops only marginally more often than Boomers (3.2), but each Gen Z order averages €63 compared to €53 for Boomers: a €10-per-basket difference that compounds across the year.
The basket-size gap, not frequency
Conventional wisdom holds that younger digital natives simply order more often. The data from September 2025 through August 2026 shows the opposite: Gen Z and Boomer order frequencies are statistically indistinguishable, while the average basket tells the real story. Gen Z's higher share of electronics spend — 22% of categorised purchases versus 16% for Boomers — helps push their per-order value up. For context on where exactly those euros land by category, see how Gen Z and Boomer spending splits across product categories. Millennials, who lead all generations at €264 per month with 4.2 orders, demonstrate that both levers can work together as consumers move through peak earning years. Gen Z is entering that same trajectory: with global Gen Z purchasing power already estimated at $450 billion and the cohort moving into its strongest earning years, its online spending in Germany is positioned to grow further through 2030.
This analysis is based on public segment data. For deeper cuts, use our Enterprise interface.
Ask your own question of this data.
This chart is one cut of the panel. In a demo we answer your question on the same data, live.
Methodology
Monthly online retail spending was measured for German active online buyers born between 1946 and 2007 over the twelve months from September 2025 through August 2026. An active buyer is defined as someone who made at least one qualifying purchase during the observation window. Spend covers online retail purchases across e-commerce email receipts and connected marketplace accounts; financial services, utilities, transport, insurance, and digital-only purchases such as app-store transactions are excluded. Individual annual spend was capped at the 99th percentile to limit the influence of extreme outliers. Monthly figures are derived by dividing twelve-month totals by twelve. Generational spending estimates are calibrated to the German online buyer population using official demographic benchmarks (age, gender, region).
These insights are based on the General Evidence Panel. Our data comes exclusively from users who are compensated for their anonymity. Become part of the panel & earn from your data