TikTok Weekly Watch Distribution (Interquartile Range) by Age in Germany — Q1 2025
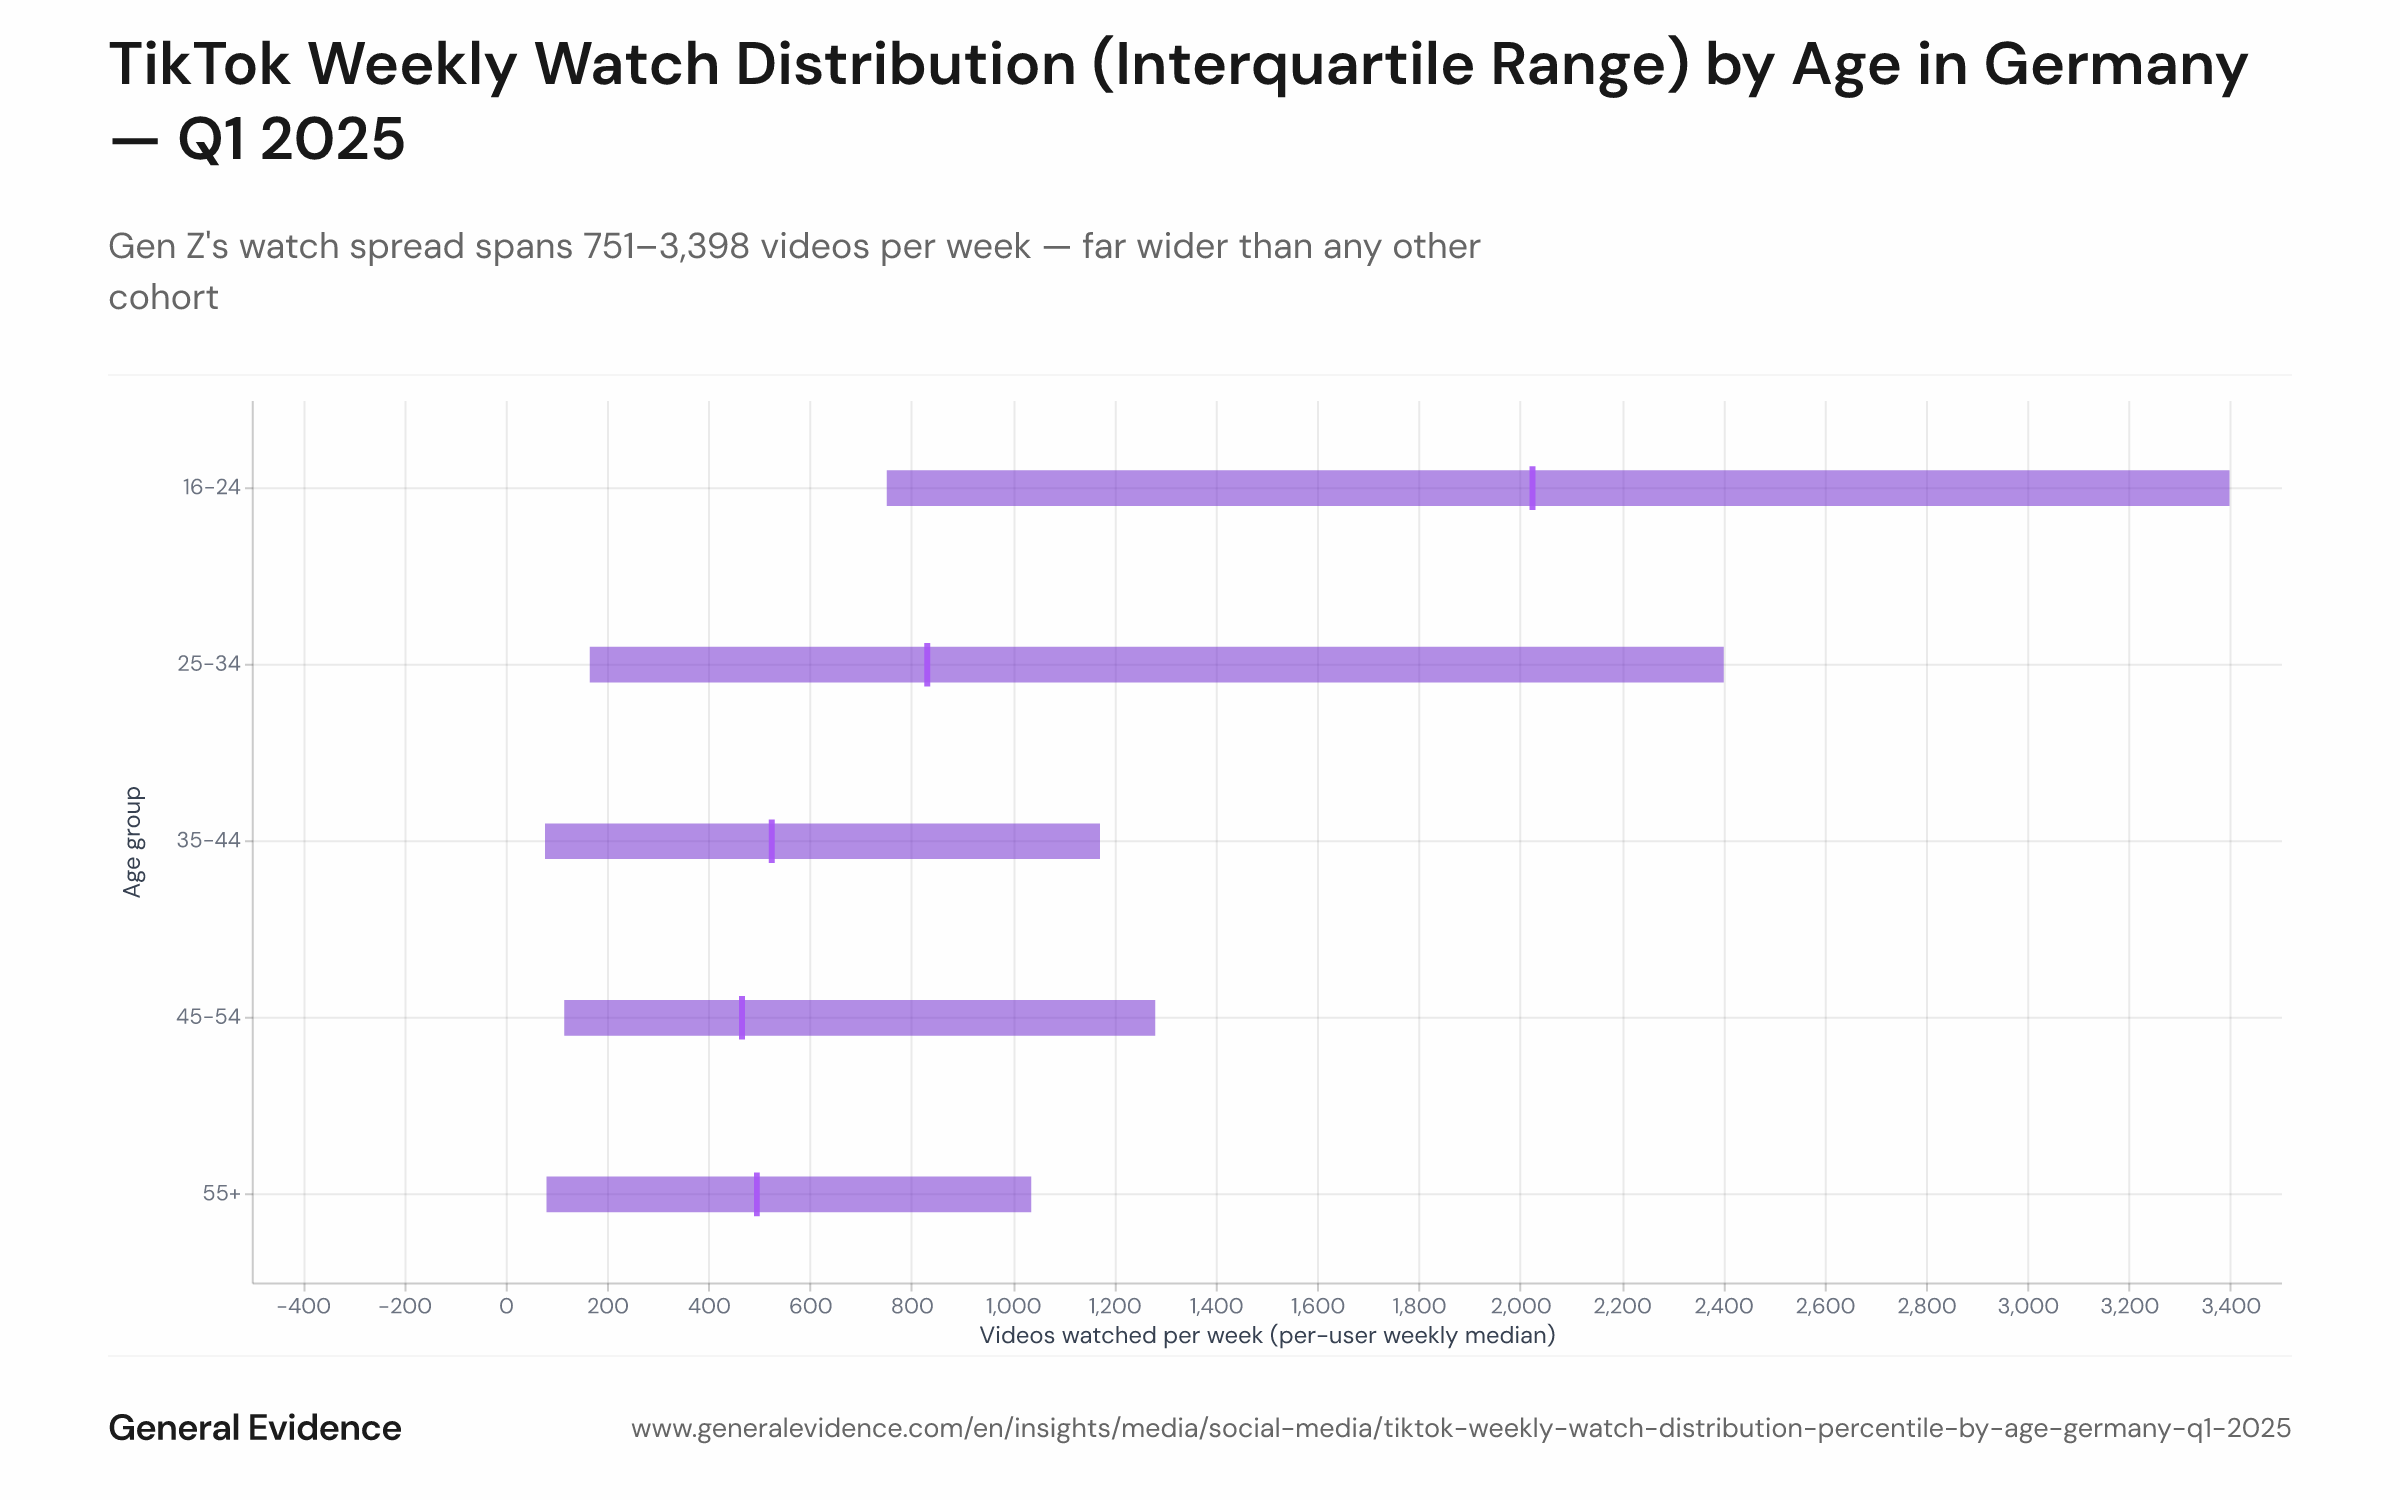
Review Q1 2025: Gen Z's watch spread spans 751–3,398 videos per week — far wider than any other cohort
License: CC BY 4.0 · Source: General Evidence · How to reuse
Info
- Sample size
- n = 570
- Data date
- Q1 2025
- Segment
- All segments
- Platform
- TikTok
- Market
- Germany
Analysis
While median watch counts reveal age-based differences in typical behavior, the spread within Gen Z reveals stark inequality in viewing intensity. The middle 50% of 16–24-year-olds spans from 751 to 3,398 weekly videos—a 4.5× range. By contrast, 35–44-year-olds occupy a compressed band of 78–1,172, and 55+ range from 235–1,179. This dispersion indicates that TikTok consumption among Gen Z is highly polarized: some are occasional viewers, while others consume the platform obsessively.
This analysis is based on public segment data. For deeper cuts, use our Enterprise interface.
Ask your own question of this data.
This chart is one cut of the panel. In a demo we answer your question on the same data, live.
Methodology
Each user (with ≥2 active weeks in Q1) assigned a per-user median weekly watch count. Cohort distribution summarized as 25th percentile (Q1), median (50th), and 75th percentile (Q3). Sample after the ≥2-week filter: 570 users (16–24 n=144, 25–34 n=169, 35–44 n=155, 45–54 n=63, 55+ n=39).
These insights are based on the General Evidence Panel. Our data comes exclusively from users who are compensated for sharing their data. Become part of the panel & earn from your data