Shopping App Time per Day: Germany 2026
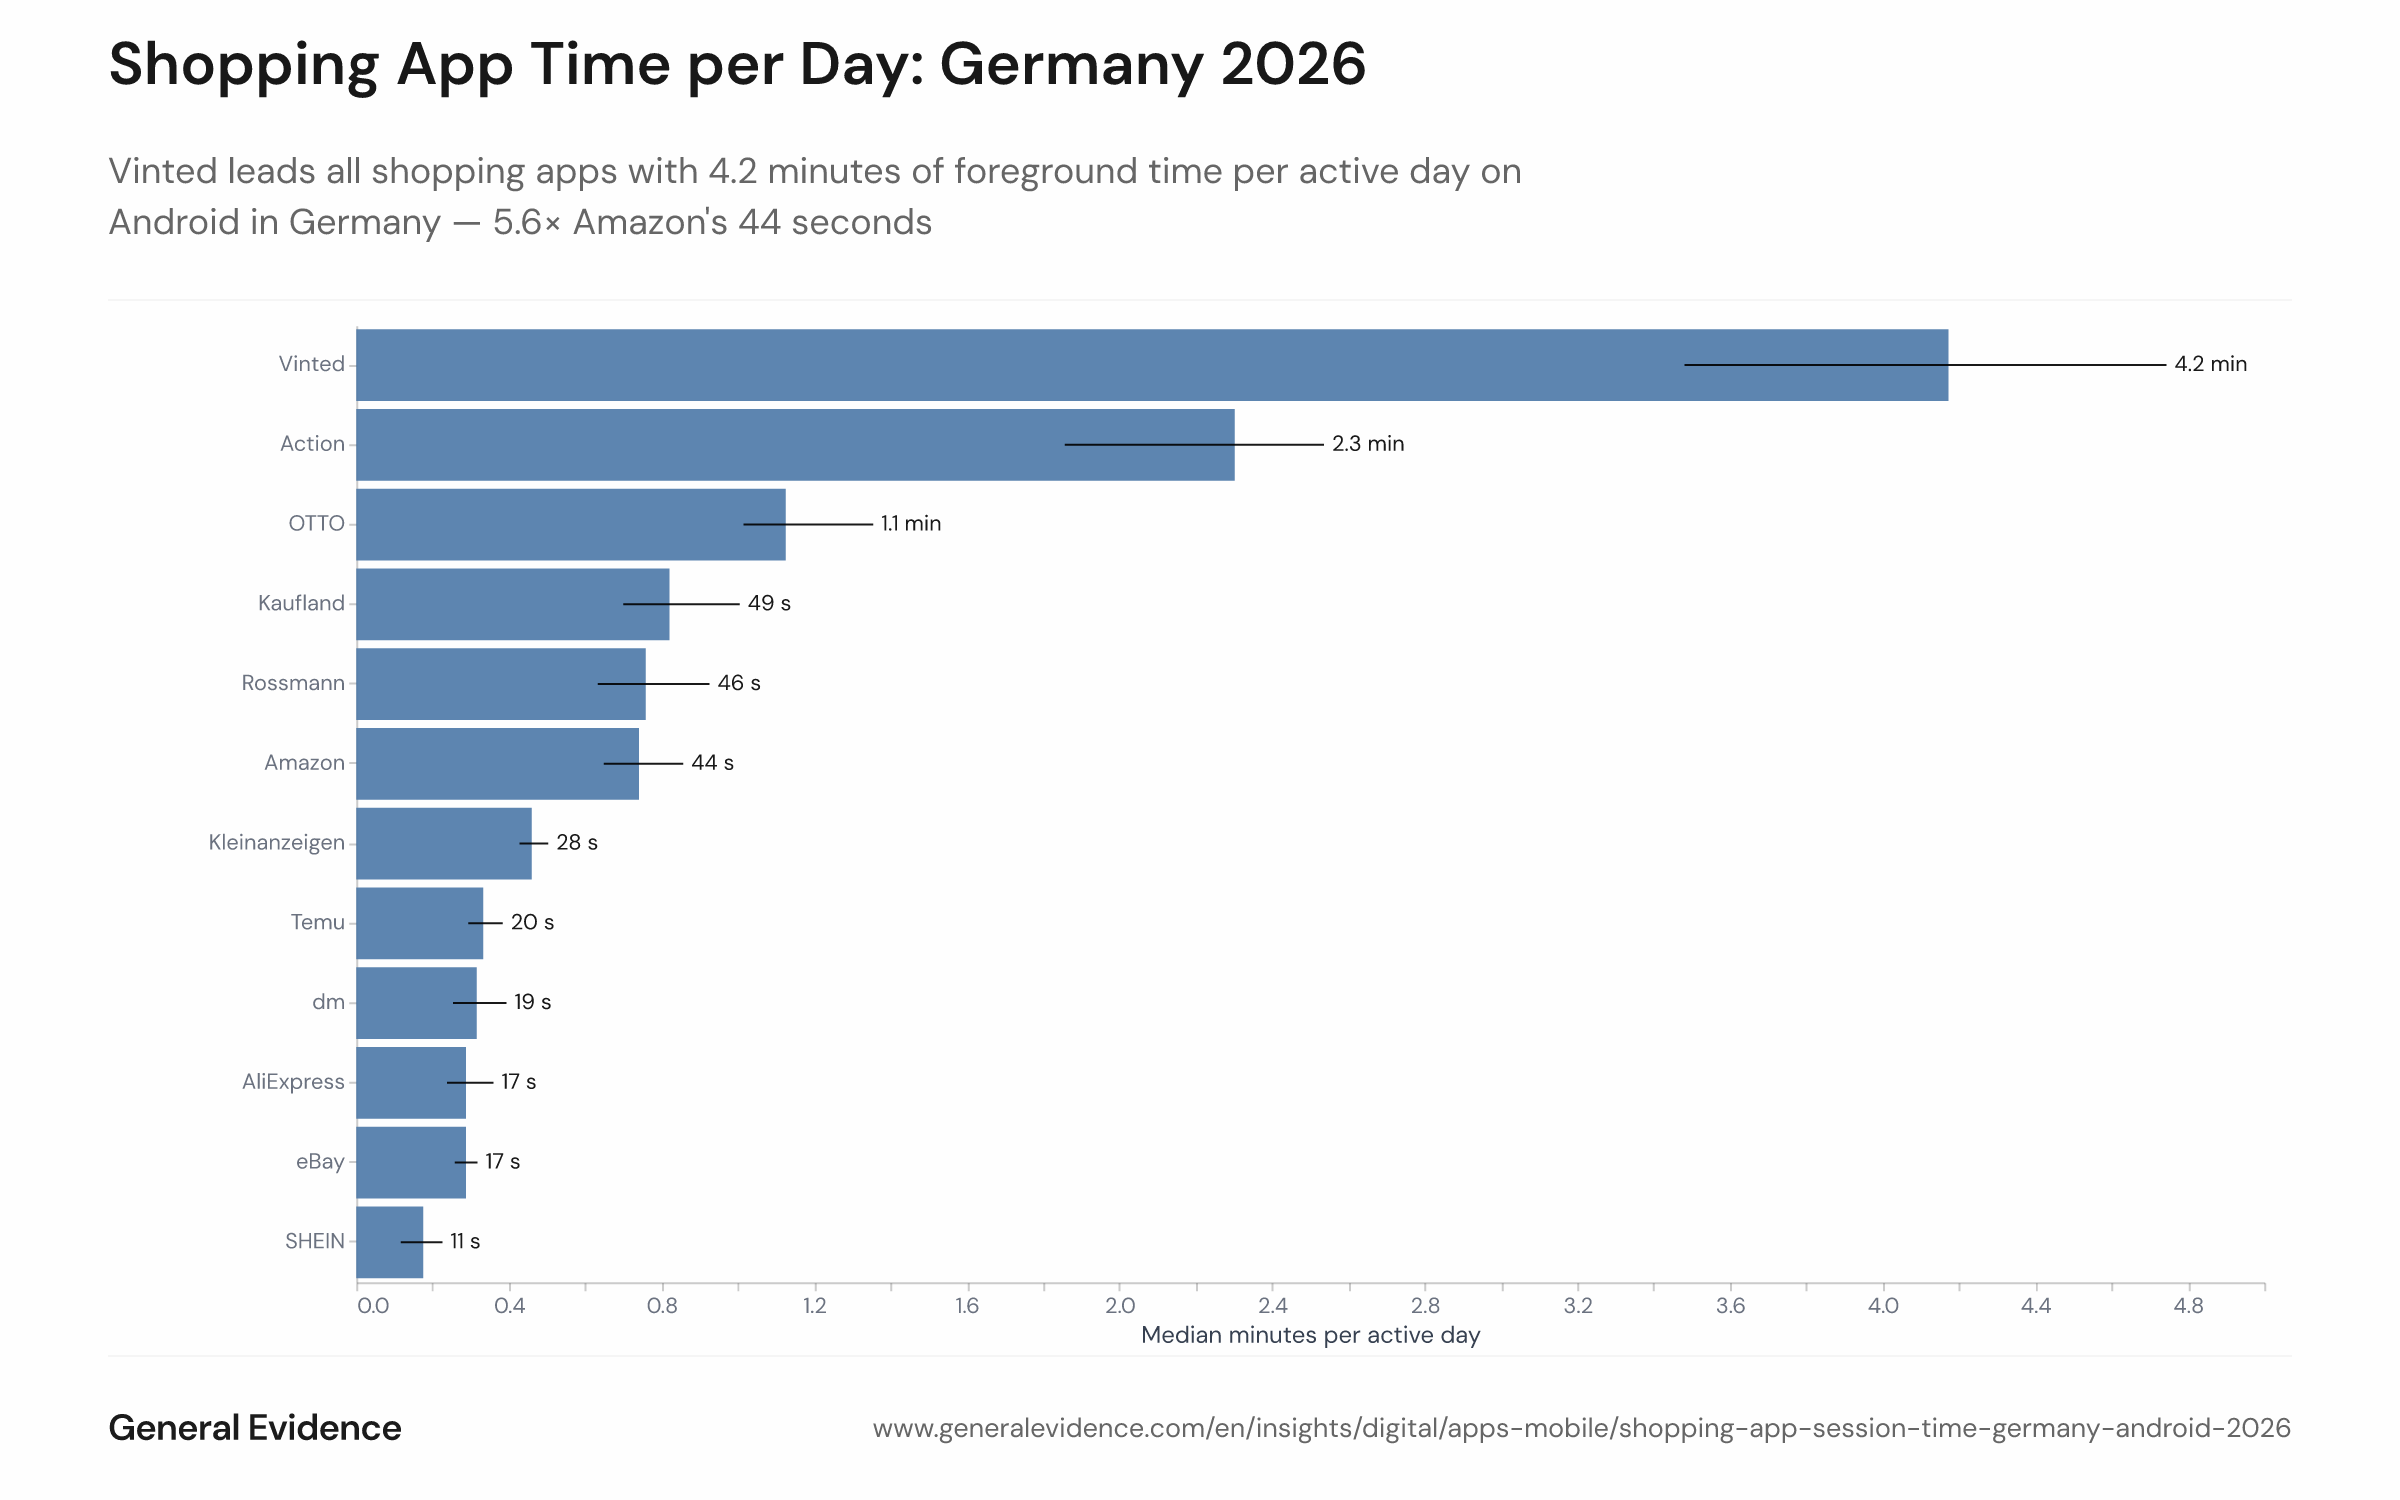
Review Sep–Oct 2026: Vinted leads all shopping apps with 4.2 minutes of foreground time per active day on Android in Germany — 5.6× Amazon's 44 seconds
License: CC BY 4.0 · Source: General Evidence · How to reuse
Info
- Sample size
- n = 8,749
- Data date
- Sep–Oct 2026
- Segment
- All segments
- Platform
- Android
- Market
- Germany
Analysis
Among the most-used shopping apps in Germany, Vinted commands by far the deepest per-session engagement on Android: a median of 4.2 minutes of active foreground time on each day a user opens it — more than five times the 44 seconds logged by Amazon, the second-most-installed shopping app in the country. The gap is not just large; it reframes what "mobile shopping app engagement" in Germany actually looks like in 2026.
Why Vinted's lead is structurally different from Amazon's
Amazon is opened on roughly twice as many days as Vinted — its strength is breadth and frequency, not depth. Vinted users browse, list, negotiate, and revisit listings in long, immersive sessions that reflect the nature of the recommerce format: discovery-led, non-urgent, and socially paced. That dynamic mirrors Vinted's wider momentum: the platform reported 47% GMV growth to €10.8 billion in 2025, and Germany emerged as a key investment market for the company despite a more competitive landscape there. Action (2.3 min) and OTTO (1.1 min) are the only other apps that crack the one-minute mark. Temu, SHEIN, eBay, and AliExpress all fall below 20 seconds — long touted as engagement-first apps, their actual per-day session depth in Germany trails sharply. TikTok Shop, launched in Germany in March 2025 and generating an estimated €175 million in German GMV in the 90 days to July 2026, does not yet appear in these rankings; its arrival may reshape the engagement landscape heading into the 2026 holiday season. For a look at how session depth connects to actual purchase behaviour across these apps, see Session depth and purchase rates across shopping apps.
This analysis is based on public segment data. For deeper cuts, use our Enterprise interface.
Ask your own question of this data.
This chart is one cut of the panel. In a demo we answer your question on the same data, live.
Methodology
Foreground time per active day is measured as the total on-screen minutes a user spent in each shopping app, divided by the number of days they opened it at least once, over the 56-day window from September 1 to October 26, 2026 (the final two partial days were excluded). The metric is the weighted median across German Android users aged 18 and over who used each app at least once during the period; weights are calibrated to German adults by age, gender, region, education, and income. Only apps with a sufficiently large effective sample were included; apps used primarily for price comparison or loyalty coupons — such as Idealo and Lidl Plus — were excluded. Foreground time is recorded by the Android operating system and reflects active screen-on sessions only; iOS usage is not included.
These insights are based on the General Evidence Panel. Our data comes exclusively from users who are compensated for sharing their data. Become part of the panel & earn from your data